
Value at Risk (VaR) is now considered as a standard measure of market risks and has been widely implemented by financial institutions. The VaR of a market position is a single number attempting to summarize the risk of that position. It is defined as the worst expected loss of the position over a given period of time, at a given confidence level. For example, for a probability level of 99%, a VaR equal to $1M means that the loss of the position should not exceed $1M in 99 cases out of 100 on average. A natural question arises in risk management: how much can the position lose on the exceptional 100th case? This simple question is the basis for the motivation of the research.
The contribution of this paper is to propose a simple statistical framework to define the expected loss beyond the VaR. Called BVaR, this risk measure takes into account the profile of the losses beyond the VaR. While the VaR focuses on the frequency of extreme events, BVaR integrates both the frequency and the size of extreme events. With a Gaussian distribution for the returns on the position, VaR is a sufficient statistic to analyze the risk of the position as it is directly related to the standard deviation of the distribution. However, in general, VaR does not give a full picture of the risk of a position as more information is needed to fully or better understand its risk characteristics. This new measure is important when the distribution of asset returns is fat-tailed or when the position is non-linear due to the presence of options of the implementation of complex trading rules.
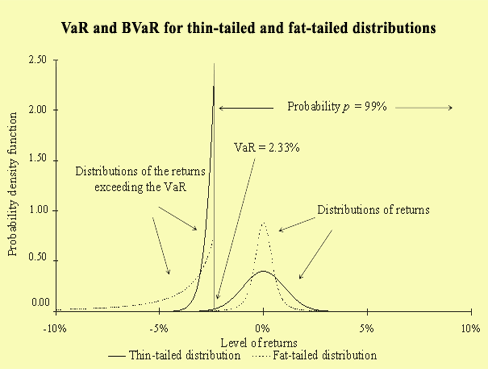
For a given confidence level, a non-Gaussian distribution may give the same VaR number as the Gaussian distribution but may present a very different distribution of the losses exceeding the VaR. The losses exceeding the VaR may be concentrated near the VaR, as for a thin-tailed distribution, or, on the contrary, widely spread beyond the VaR, as for a fat-tailed distribution. This is illustrated in the figure below.

The article also presents empirical results for the U.S. stock market. For a linear position, the risk measured by BVaR is largely underestimated with the Gaussian distribution compared to the historical distribution and extreme value distribution. This effect is even stronger for non-linear positions with options.
 Return to the publication list
The asymptotic distribution of extreme stock market returns
From VaR to stress testing : the extreme value approach
Optimal margin in futures markets