
Risk management tools such as value at risk models have been developed both by practitioners and academics to measure the risk of market positions. As extreme events are a central issue in risk management, the methods used to compute the VaR (the historical method, the simulation method and the Monte Carlo method) have been completed by stress testing methods.
Stress testing methods examine the impact of simulated large movements in risk factors on the value of the portfolio. The first step is to define stress values for the risk factors considered in the analysis. In a well-known report, the Derivative Policy Group suggests the following guidelines: parallel yield curve shifting by ±100bp, yield curve twisting by ±25bp, equity index values changing by ±10% and currencies moving by ±6%, volatilities changing by ±20% of current values. The second step is to compute for each scenario the change in the value of the portfolio based on the changes in the risk factors values previously defined. The main criticism that has been addressed to stress testing methods is that it is difficult to quantify the probability attached to catastrophe scenarios. As a consequence, there may be some relative difference by assuming the same stress values for risk factors of a given class of assets (say foreign exchange rates).
The contribution of this paper is to propose a rigorous method to compute a coherent set of stress values for risk factors. By "coherent" I mean stress values computed for the same probability level. As stress testing is directly related to the occurrence of extremes in financial markets, I use extreme value theory. This statistical theory states that the asymptotic distribution of extremes has a well-determined form, which is independent of the entire process of returns. The extreme value distributions obtained from different distributions of returns are differentiated only by the value of the three parameters of the distribution: the scale and location parameters and the tail index. Especially the tail index indicates the way the tail of the distribution declines. According to the tail weight, three types of extreme value distribution are obtained: Weibull, Gumbel and Fréchet. As a separate estimation can be down for negative and positive extremes, the method also allows one to distinguish between long and short positions. This is important as the weight of the left and right tails of the distribution may be different.

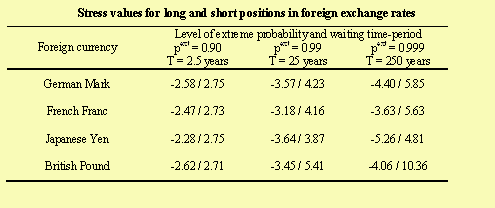
The table above gives stress values for foreign exchange currencies computed with different levels of extreme probability or equivalently different levels of waiting time-period. The waiting time-period represents the average time expressed in years needed to observe a shock lower than a given level. It takes the case of long and short positions for a U.S. investor in the foreign currency. An interesting result is the symmetry of the results for long and short positions. Some differences also appear across foreign exchange rates suggesting that taking a unique value for all risk factors may not be coherent.
 The asymptotic distribution of extreme stock market returns
 From VaR to stress testing : the extreme value approach
 Extreme correlation in international equity markets
 Retour à la liste des publications
 Conseil en gestion des risques
 Glossaire de termes financiers